Get insights.
Unlock value.
- 14-day free trial
- Set up in minutes
- End-to-end encrypted
Turn 500 Open-Ended Survey Responses into Actionable Institutional Insights in Under 1 Hour

Feeling overwhelmed by open-ended survey responses?
If you’re an institutional researcher, chances are you’ve been through this:
You run a campus-wide survey and get hundreds, maybe thousands of open-text responses. Great! Rich, qualitative data. Real voices. But then the panic sets in:
- “How do I even begin making sense of all this?”
- “Do I have to read every single response?”
- “How am I supposed to pull themes, quotes, AND insights - by next week?”
Whether it’s a climate survey, end-of-course feedback, or a student experience study, open-ended responses are often the most valuable part of the data, and also the most exhausting to deal with.
We all want to tell leadership what students and staff are really saying. But the reality? Most of that insight is buried under a bunch of text and no one to help you out.
The cost of using traditional analysis methods
Honestly, manually analyzing qualitative feedback is exhausting and time-consuming.
Reading 500 responses one by one? Tagging themes manually in Excel? Trying to pull out trends and counts with a color-coded spreadsheet? That’s hours (if not days) of work - just to get a few paragraphs into a report.
But here’s what it really costs you:
- Slower turnaround: By the time you’ve pulled insights, the moment has passed.
- Missed patterns: You can’t see the big picture when you’re deep in the weeds.
- Burnout: Repetitive coding and labeling isn't why you got into this work.
- Limited capacity: You end up skipping responses or shortening the analysis, which means missing out the insights that have to be delivered in a correct timing for decision making.
And the people requesting the data? They’re expecting clean, clear takeaways. They want themes, trends, and quotes now. Not two weeks from now.
Manual analysis just doesn’t scale anymore.
What if your survey responses could analyze themselves?
Here’s the good news: you don’t have to do this manually anymore.
With BlockSurvey, you can take those 500 open-ended responses and get organized, theme-based insights in less than an hour. Want to know how to analyse your survey responses? Check out our guide to analyse a large set of survey responses.
Seriously. Upload your CSV or connect your form, and BlockSurvey does the rest:
What BlockSurvey’s AI does for you:
- Detects common themes and keywords automatically
- Tags responses by category - think “faculty support,” “facilities,” “advising,” etc.
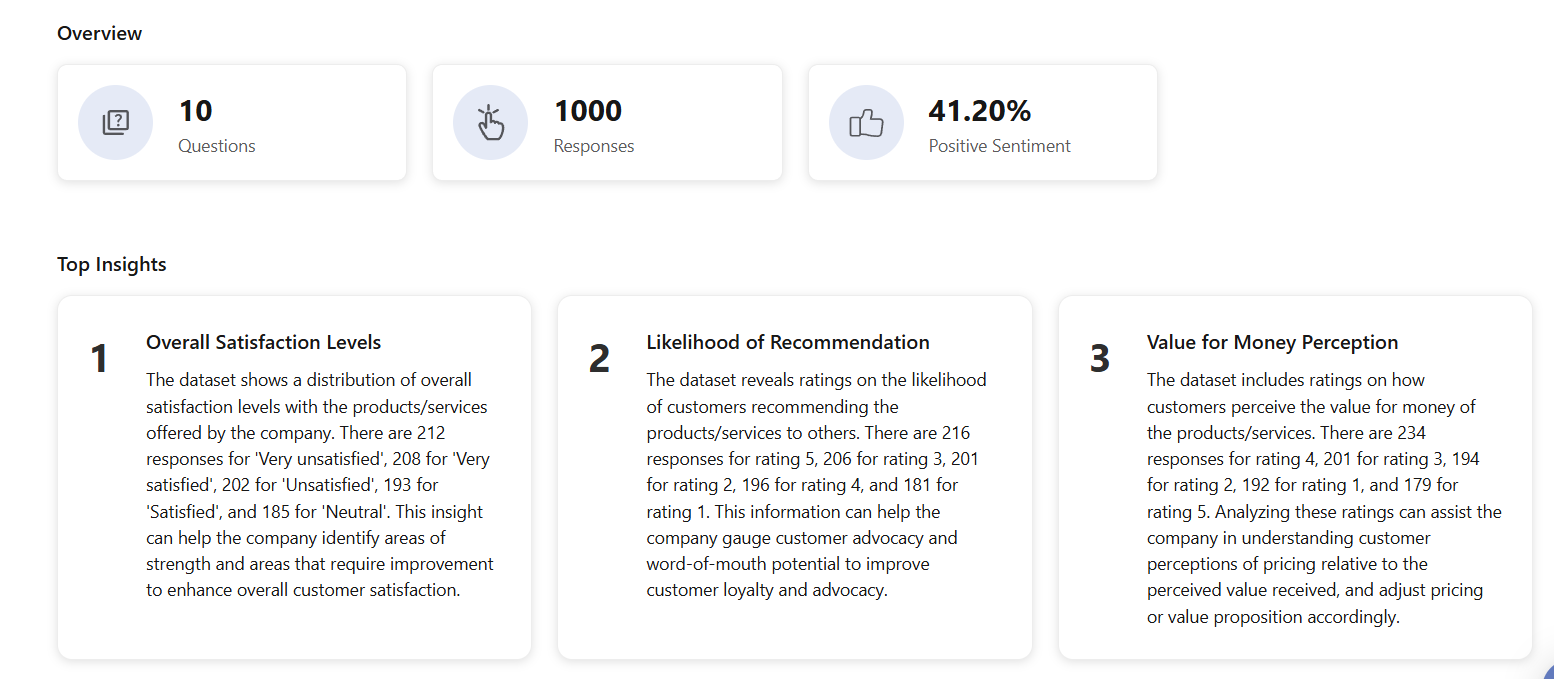
- Summarizes key feedback into clear sections with counts and representative quotes
- Surfaces sentiment - positive, negative, neutral across themes
- Exports clean, structured data that’s ready for your report or dashboard
- No manual coding. No trying to “eyeball” themes. Just clear, actionable insight - instantly.
And yes, your data is fully encrypted and private. No data sharing, no tracking - BlockSurvey is privacy-first, and built with research compliance in mind. Want anonymous feedback from students/faculties use our anonymous seal to protect their privacy.
How institutional researchers are using this in the real world
Here’s what this looks like in action:
You run a feedback survey for new students. BlockSurvey shows you that “orientation,” “advising delays,” and “tech issues” are coming up most often - with direct quotes to back each one.
Campus climate assessments
You collect thousands of comments from students and staff about belonging and inclusion. BlockSurvey breaks it down into themes like “representation,” “safety,” and “support services,” and helps you spot trends across departments.
Course and program evaluations
Instead of skimming hundreds of free-text answers on what’s working and what’s not, you use BlockSurvey to summarize key areas of concern and student praise. Now your academic teams have feedback they can actually act on.
Why this matters (especially now)
The pressure on IR teams is growing - faster turnaround, more insights, and clear storytelling with limited time and team size.
BlockSurvey helps you stay ahead by:
- Letting you analyze more responses without needing more hours
- Giving you clean, usable qualitative insights for your reports and dashboards
- Saving you time so you can focus on strategy and communication, not coding answers
You didn’t become a researcher to tag open-text responses all day. This is your way out.
Final thoughts
If you're still manually going through survey responses one by one, you're spending your time in the wrong place. With BlockSurvey, you can turn 500 (or even 5,000) open-ended answers into real insights - without the burnout. You’ll go from “Where do I even start?” to “Here’s exactly what people are saying, and here’s what we’re doing about it” - all in under an hour.
Try it out. Save time. Get better insights. Have more questions? Book a demo now!
Turn 500 Open-Ended Survey Responses into Actionable Institutional Insights in Under 1 Hour FAQ
Do I need to manually set up tags or themes before uploading responses?
Can I use this with data from tools I already use (like Qualtrics or Google Forms)?
What about sensitive feedback? Is this platform secure and private?
Can I export the insights and charts for my reports or presentations?
I’m not very technical — do I need any training to use this?
Get insights.
Unlock value.
- 14-day free trial
- Set up in minutes
- End-to-end encrypted
Swathi Lakshmi
Swathi leads the Growth Team at BlockSurvey, ensuring the company reaches new heights. When away from the office, Swathi indulges in movies, enjoys a wide variety of music, and loves to travel to new and exciting locations.