Get insights.
Unlock value.
- 14-day free trial
- Set up in minutes
- End-to-end encrypted
How to analyze survey data using Crosstab?

Say you run a survey to learn how people feel about a new product. Once the responses come in, you still have to work out whether certain groups lean toward one feature over another. Cross-tabulation, or crosstab, is the method that lets you do that.
What is a crosstab?
A crosstab, also called a contingency table, is a way to analyze categorical data. It compares two or more variables by laying the results out in a matrix, so relationships and patterns that are hard to spot in a flat list of answers become easier to read.
Benefits of using crosstabs in surveys
- Reduce confusion: Crosstabs organize complex data into a clear format, which makes it easier to read and interpret.
- More granular data points: They give a detailed view, so you can drill into specific segments.
- Actionable insights: By showing patterns and relationships, crosstabs surface findings you can act on when making decisions.
- Clarity of interpretation: The tabular format makes relationships easy to read and conclusions easier to draw.
- Identify relationships: Crosstabs expose links between variables that are not obvious at first glance.
- Trend analysis: They help track how data shifts over time.
- Comparative analysis: Crosstabs make it straightforward to compare different groups or variables side by side.
How to analyze data using crosstab in BlockSurvey
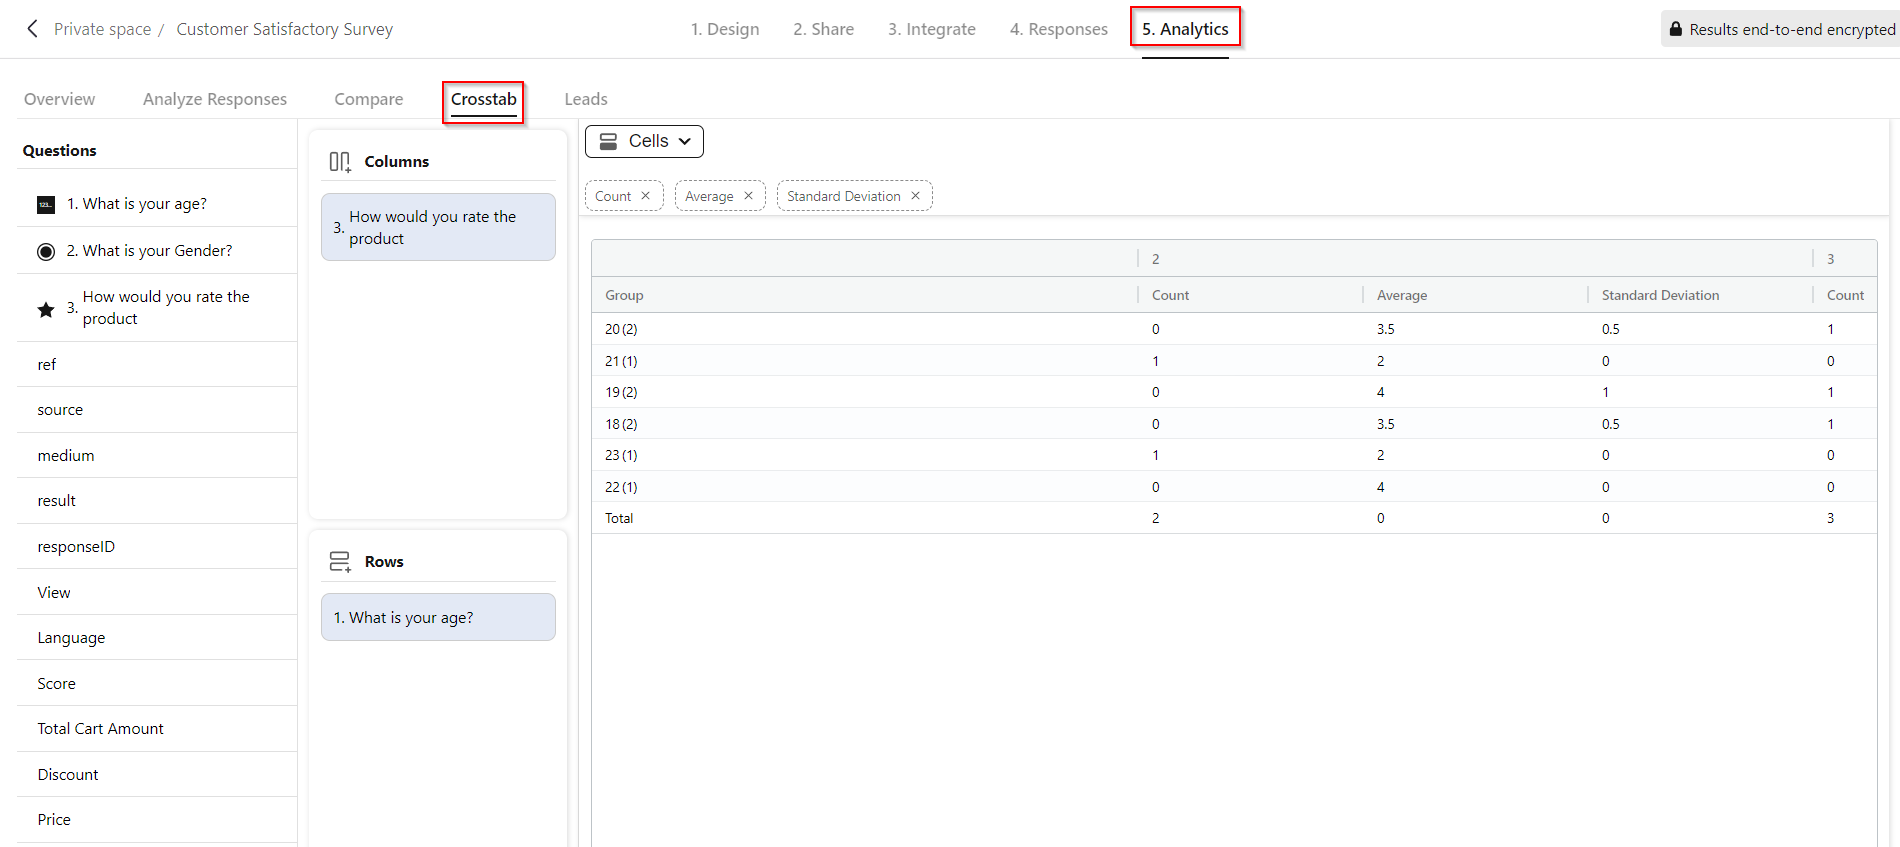
Once your survey is published and responses are coming in, here is how to analyze them with Crosstab:
- Go to the Analytics screen and select Crosstab.
- On the left, you will see your survey questions, variables, and expressions.
- Drag and drop the questions, variables, or expressions you want into Columns and Rows.
- The Count function is selected by default under the Cells dropdown.
- You can also multi-select other functions such as Average and Standard deviation under Cells to fit your analysis.
- The Crosstab table is generated and shows the data.
Use cases for crosstabs
Crosstabs work best when your data splits into mutually exclusive groups, that is, categorical variables. A few common cases:
- Market research: Researchers use crosstabs to compare consumer preferences across demographics and target their marketing accordingly.
- Customer satisfaction: Businesses examine satisfaction levels across different service areas and demographics.
- Employee surveys: Organizations read employee feedback segmented by department, role, or tenure.
- Healthcare: Providers analyze patient data to find patterns in treatment outcomes across patient groups.
Conclusion
Crosstab helps you pull meaningful findings out of survey data. By organizing the responses in a structured way, it shows the relationships and trends behind strategic decisions. Use BlockSurvey's Crosstab feature to turn raw responses into results you can act on.
Crosstab pairs well with market research surveys. Explore more BlockSurvey features or browse survey templates.
How to analyze survey data using Crosstab? FAQ
How do you interpret a crosstab?
Is cross tabulation a pivot table?
Can you do crosstabs in Excel?
What is the difference between cross tabulation and ANOVA?
What is a crosstab report?
Get insights.
Unlock value.
- 14-day free trial
- Set up in minutes
- End-to-end encrypted
Wilson Bright
Wilson Bright is the co-founder of BlockSurvey, an AI-native, privacy-first survey platform designed to help Institutional Researchers uncover deeper, more actionable insights. He believes the future of Institutional Research lies in combining ethical data collection with intelligent automation to make evidence-based decisions faster, fairer, and more transparent.